Effects of Volatility Drag
Volatility Drag
Volatility drag refers to the negative impact of market fluctuations on the long-term growth of an investment's value. It occurs because the geometric average return (actual growth of wealth over time) is always less than the arithmetic average return when there is volatility.
Key Points:
Why it happens: Losses hurt more than equivalent gains help. For example, if an investment drops 50%, it needs a 100% gain to recover.
Effect: Higher volatility (big price swings) reduces overall returns over time, even if the average return looks good on paper.
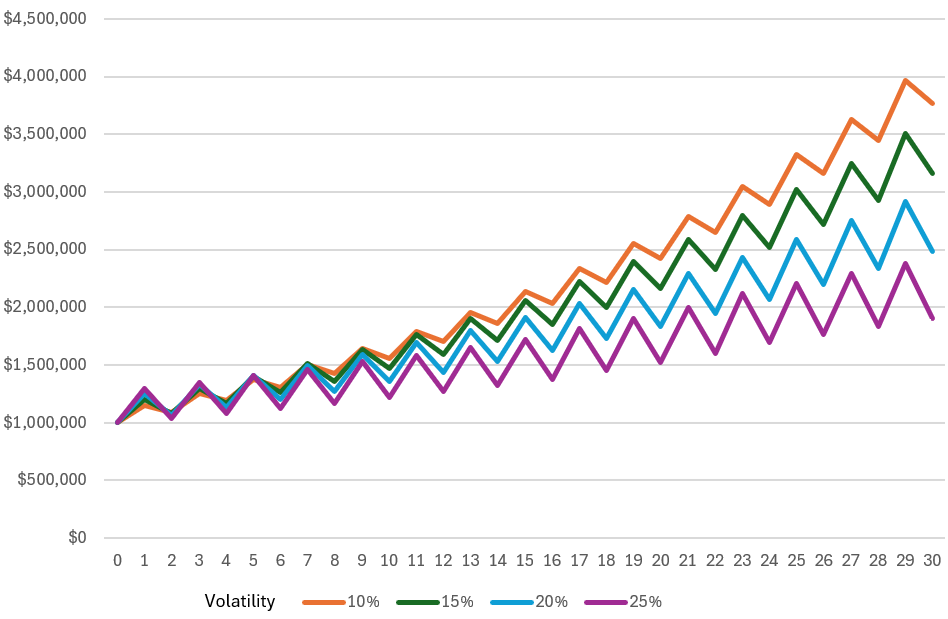
All four of the lines above represent an average 5% return. The only difference between them is how much the returns fluctuate from year to year. In our example:
The 10% volatile portfolio is up 15% (5% + 10%) one year, down 5% (5% - 10%) the next, repeated for 30 years.
The 15% volatile portfolio is up 20% (5% + 15%), down 10% (5%- 15%) the next.
The 20% volatile portfolio is up 25%, down 15% the next.
The 25% volatile portfolio is 30%, down 20% the next.
In the short run, there’s not a wide difference in outcomes; notice how after year three years or so the portfolios are tracking fairly closely. But after about the tenth year they begin to diverge quite a bit. And after 30 years, the differences are dramatic. The 10% volatility portfolio has more than $3.7mil but the 25% volatility portfolio has only $1.9mil.
RichKat Investing puts volatility front and center for you to make your investment decisions. Get started and create your portfolio and see how volatility is affecting your returns and learn how to reduce volatility.
10% volatility
starting value $1,000,000
terminal value (30 years) $3,769,574
15% volatility
starting value $1,000,000
terminal value (30 years) $3,157,542
20% volatility
starting value $1,000,000
terminal value (30 years) $2,483,012
25% volatility
starting value $1,000,000
terminal value (30 years) $1,905,646